~.depth_phases File
The ~.depth_phases file is created on every run of mloc to collect information relevant to the constraint of focal depth. This is of greatest interest in the common case where there is insufficient data to perform a free-depth relocation and focal depth is specified by the user (dep_ command) and held fixed during the relocation (commands freh and frec).
It is important to recognize that all the output in this file is advisory in nature. No changes are made automatically to the arrival time dataset or to the inversion. To implement any change to the relocation analysis based on this file, the user must edit individual event files in some way or make changes in the command file for the next run.
The information written to the ~.depth_phases file is of two types and written from two different modules of the code. The first type of output relates to teleseismic depth phases (pP, sP and pwP) and their analysis as relative depth phases. This output is driven by the subroutine rdp_depth_test in the module mloclib_tt.f90. The second part of the output is driven by the module mlocout_phase_data.f90 and displays data at epicentral distances at which the arrival time of a direct phase provides depth constraint.
Relative Depth Phases
The unusual approach used in mloc to analyze teleseismic depth phases is discussed elsewhere, but the data behind that analysis are carried in the first section of the ~.depth_phase file. First is a summary of the results of the analysis of relative depth phases; only events with one or more (unflagged) relative depth phases are listed. Here’s a sample of the first six events in a cluster:
  1 19300506.2234.23               preferred depth =   5 km (  1 to  13) on   1 samples (depd   5  8  4 ! on   1 samples)
  5 19520930.0250.40               preferred depth =   5 km (  1 to  14) on   1 samples (depd   5  9  4 ! on   1 samples)
  7 19670517.0428.50               preferred depth =   7 km (  2 to  14) on   2 samples (depd   7  7  5 ! on   2 samples)
  8 19700314.0151.43               preferred depth =  10 km (  4 to  16) on   5 samples (depd  10  6  6 ! on   5 samples)
 11 19761124.1222.15               preferred depth =  31 km ( 17 to  38) on   2 samples (depd  31  7 14 ! on   2 samples)
 12 19761124.1511.02               preferred depth =   8 km (  4 to  18) on   1 samples (depd   8 10  4 ! on   1 samples)
The part in parentheses after the number of samples can be copied and pasted directly into a command file to implement the depd command, including the part after the “!” symbol, which the command parser will treat as a comment. After the summary section is a detailed listing of the relative depth phase data for each event, shown here for the same six events:
Residuals against each theoretical phase for the depth with minimum misfit
                        MNF      pP-P      sP-P     pwP-P     Err**2
Event   1 19300506.2234.23                  5 km
  VIE   22.94 pP-P       95      1.04      0.16      1.04      0.02 p sP-P
  TYK   69.32 pP-P      338      0.78     -0.04      0.78      0.00   sP-P
Event   5 19520930.0250.40                  5 km
  TAM   36.40 pP-P       98      0.78     -0.12      0.78      0.01   sP-P
Event   7 19670517.0428.50                  7 km
  NIE   20.20 pP-P       42      1.40      0.22      1.40      0.05 p sP-P
  NUR   25.13 pP-P       57     10.22      8.99     10.22     80.80 p sP-P
  FUR   25.58 pP-P       63      4.22      3.08      4.22      9.49 p sP-P
  FUR   25.58 sP-P       64     11.22     10.08     11.22    101.60 p
  KLS   25.85 sP-P       66     10.42      9.28     10.42     86.06 p
  KJN   27.34 pP-P       73      0.91     -0.32      0.91      0.10   sP-P
  UDD   28.86 pP-P       79      0.20     -1.03      0.20      0.04
  TAM   36.48 pP-P       92     74.18     73.05     74.18   5336.23 x sP-P
Event   8 19700314.0151.43                 10 km
  NIE   20.59 pP-P       71      0.78     -0.56      0.78      0.31 p sP-P
  NIE   20.59 sP-P       72      5.78      4.44      5.78     19.74 p
  NUR   25.35 pP-P      102     -1.53     -2.95     -1.53      2.34 p
  FUR   26.00 sP-P      112      3.34      2.07      3.34      4.27 p
  MOX   26.29 pP-P      119     -1.17     -2.44     -1.17      1.37
  KJN   27.50 pP-P      125      0.45     -0.96      0.45      0.20
  OUL   28.74 pP-P      136      1.24     -0.17      1.24      0.03   sP-P
  BNS   29.11 sP-P      140     -2.69     -3.95     -2.69      7.23 x pP-P
  TRO   34.05 sP-P      167      3.62      2.21      3.62      4.89 x
  BAB   39.34 pP-P      181      2.77      1.51      2.77      2.29   sP-P
  BAB   39.34 sP-P      182     12.77     11.51     12.77    132.59 x
  AVE   42.13 pP-P      188     15.25     14.00     15.25    195.93 x sP-P
  LAO   91.24 pP-P      261     -1.14     -2.43     -1.14      1.31
  LAO   91.24 sP-P      262      5.86      4.57      5.86     20.84 x
Event  11 19761124.1222.15                 31 km
  BRA   21.43 pP-P      241     -5.95    -10.21     -5.95     35.37 p
  BRA   21.43 sP-P      242     -0.95     -5.21     -0.95      0.90 p pP-P
  NKM   39.12 pP-P      499     -0.26     -4.36     -0.26      0.07
  NKM   39.12 sP-P      500      6.24      2.14      6.24      4.57 x
  KBS   42.02 pP-P      540      0.45     -3.54      0.45      0.20
Event  12 19761124.1511.02                  8 km
  PSZ   19.68 sP-P       58      6.53      5.26      6.53     27.69 p
  NIE   19.94 pP-P       62     10.83      9.56     10.83     91.43 p sP-P
  BUD   20.12 sP-P       65     15.02     13.76     15.02    189.29 p
  KRA   20.42 sP-P       70      9.03      7.76      9.03     60.18 p
  NUR   24.78 sP-P      101      5.76      4.51      5.76     20.33 p
  CLL   24.99 sP-P      103     15.89     14.61     15.89    213.31 p
  MOX   25.65 sP-P      111      3.89      2.60      3.89      6.77 p
  GRF   25.67 pP-P      113      6.48      5.20      6.48     27.04 p sP-P
  KJF   27.07 pP-P      118      1.26      0.01      1.26      0.00   sP-P
The pwP phase is always listed but if the bouncepoint is on land it will be the same as pP. The phase name sometimes appears twice, first as the phase used in mloc, and second as an alternative phase that would fit better at the preferred depth. In general, specifying the correct depth is extremely difficult during routine monitoring, especially for shallow events, so I place very little confidence in the reported phase name for depth phases. To change the phase name in future runs of mloc you would have to edit the event file by hand, but changing the phase name would not have any effect on the depth phase analysis, since it considers all possible depth phase associations as equally likely. The squared error column refers to whatever phase has the smallest residual at the preferred depth. Positive residuals indicate the event should be deeper.
Depth phases are often reported from stations at far-regional distances and distances where upper mantle triplications create tremendous confusion for phase identification. Following the advice of E.R. Engdahl, as employed in the EHB algorithm, depth phases reported at distances less than 26° are automatically flagged (“p”) and not considered for constraining the focal depth. The user is free to take these readings into account in making decisions about the remaining depth phase readings. The flag “p” is printed after the column with squared error.
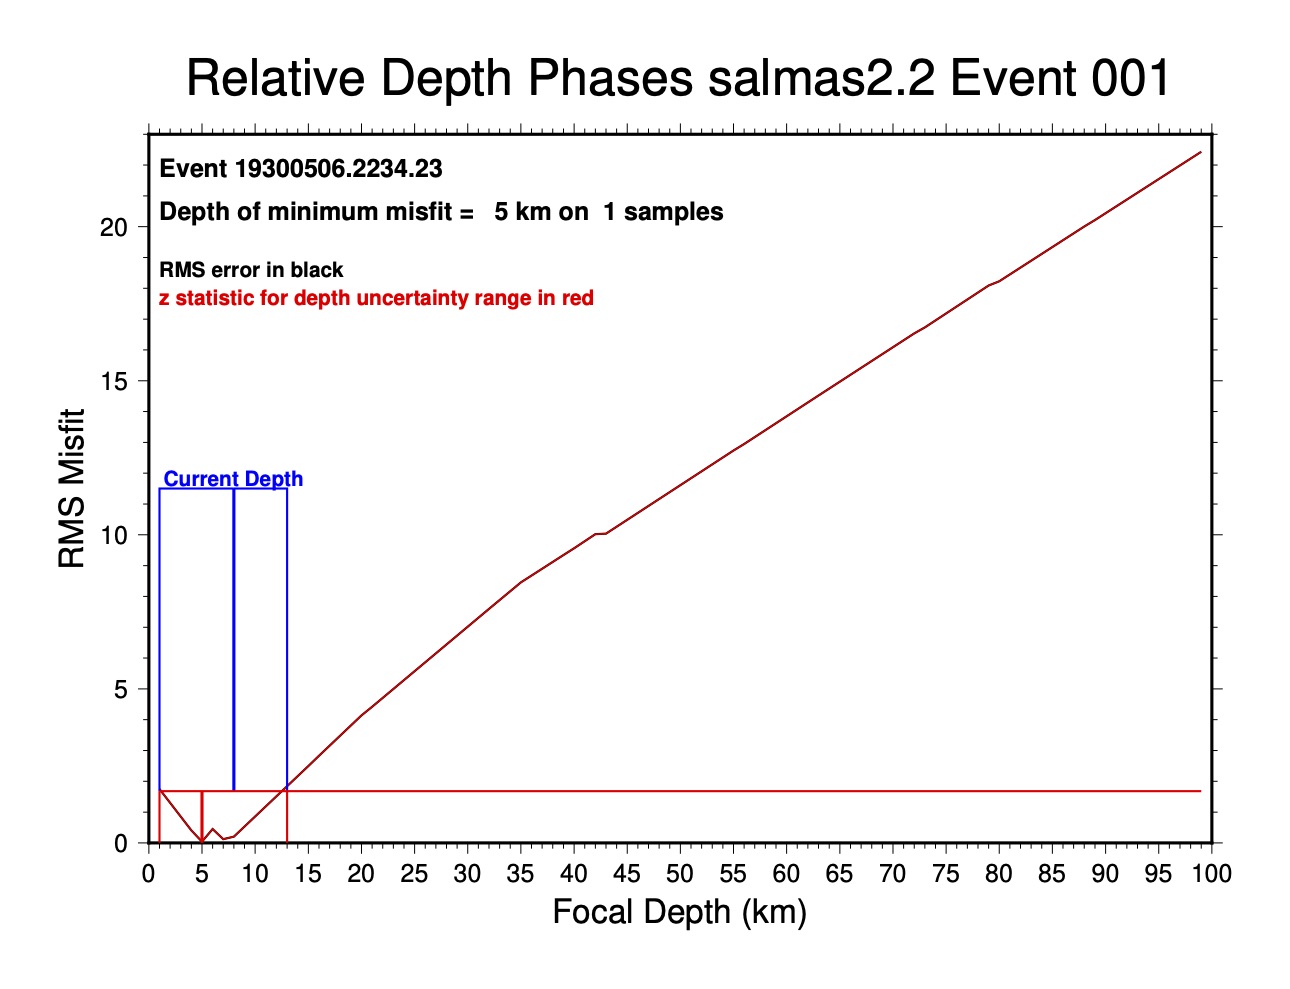
The analysis of depth phases involves a process of cleaning, i.e., identifying and flagging readings that are judged to be outliers. For depth phases this is done manually and in a rather ad hoc manner, but the number of samples is usually too small to make any statistical testing worthwhile. We are looking for a depth at which the largest possible number of readings agree (i.e., have small residuals) to within some poorly-known time. As a rule of thumb, I have found that when there are a considerable number of depth phase reports that give a strong minimum, those readings all generally have squared error values less than about 2.0. You can be rather conservative, keeping readings with squared errors of 3-4, and it will usually not effect the estimate of preferred depth very much. Of course it will expand the range of uncertainty a bit. As with the cleaning of standard arrival time data, an incremental approach is recommended, because deleting a single reading with large residual is likely to change the preferred depth and the pattern of the remaining residuals significantly on the next run. It is very helpful and instructive to refer to the plots associated with relative depth phases during the cleaning process, these are requested with the rdpp command. Here is an example (from event 8 in the list above):
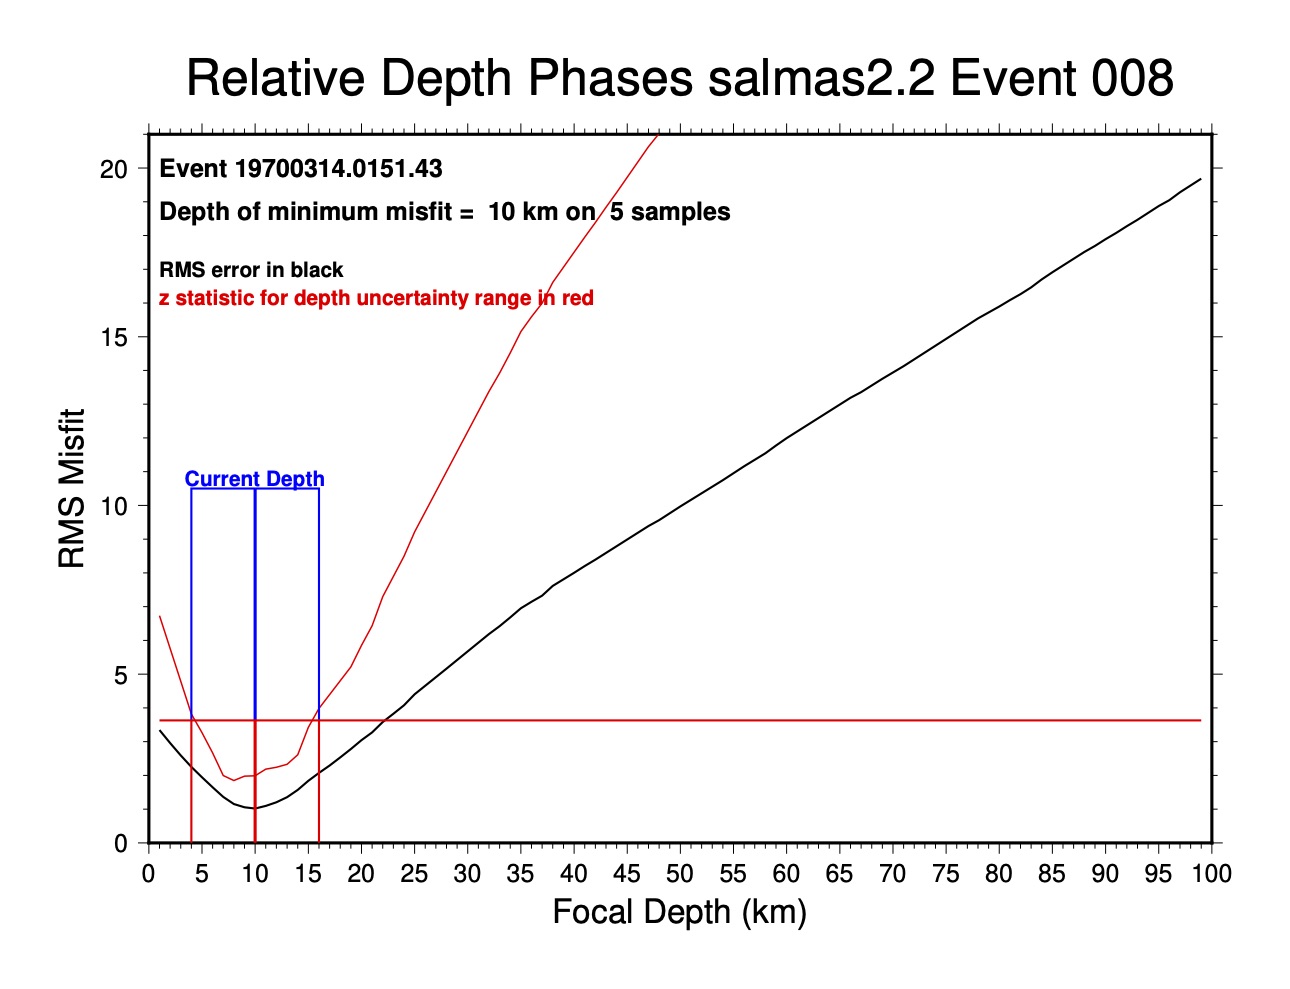
The red line is a statistic that is used to determine the preferred depth and uncertainty (the black one is just the squared error sum, a much weaker guide). The details of the statistical analysis are described here.
IMPORTANT During the normal cleaning process (using the automated utility codes lres and xdat) depth phases may be flagged because of their residuals when what is actually needed is a better estimate of focal depth. Therefore I recommend doing the analysis of relative depth phases early in the relocation analysis, before much cleaning has been done. The depth phase analysis is insensitive to location accuracy, but location accuracy can depend a lot on reliable depth constraint. Once a preferred depth has been determined it can be implemented in the command file and after that you don’t need to worry if some of the readings get flagged inadvertently.
Direct Phase Readings
The format of this section is nearly a duplicate of the ~.dcal_phase_data file, but the epicentral distance selection criterion for which readings are included is different. The threshold for epicentral distance is the larger of 100 km or three times the focal depth. In many cases (i.e., when the hypocentral distance limit for direct calibration is set especially close with command hlim) this will include some readings at greater distance than the ~.dcal_phase_data file. This is done because those readings are often still useful for helping constrain focal depth, using the local distance formulation (command depl). This example is for the same set of events as the example in the section on the ~.dcal_phase_data file, none of which have any direct arrivals within the epicentral distance range for this listing:
Cluster default depth:   15.0
Median of constrained depths:   14.0
Median of input file depths:   10.0
 STA   NETWORK    PHASE    READ  DELTA AZIM  RAY     WGT   STA  P RESIDUALS FOR ITERATION #
 CODE                       ERR             PARAM         CORR  *INP*   *0*    *1*    *2*    *3*    *4*          DTMPH  DTMPC    ECI AUTHOR   CHA PHASE0     MNF IDIF

 CLUSTER EVENT   1           19300506.2234.23                   GOOD DATA      Depth =   8.0, fixed, from depth phases
 TYK              pP-P     1.00  69.32   61   6.2   1.00  0.00  -2.2  -0.19  -0.20  -0.20                       0.0000 0.0000   0.00 ISC          pP         338    0

 CLUSTER EVENT   2           19300508.1535.24                   GOOD DATA      Depth =  15.0, fixed, from cluster default depth

 CLUSTER EVENT   3           19340222.0807.13                   GOOD DATA      Depth =  15.0, fixed, from cluster default depth

 CLUSTER EVENT   4           19401018.1225.44                   GOOD DATA      Depth =  15.0, fixed, from cluster default depth

 CLUSTER EVENT   5           19520930.0250.40                   GOOD DATA      Depth =   7.0, fixed, from depth phases
 TAM              pP-P     1.00  36.40  255   8.5   1.00  0.00  -3.0   0.15   0.16   0.16                       0.0000 0.0000   0.00 ISC          pP          98    0

 CLUSTER EVENT   6           19581026.1240.30                   GOOD DATA      Depth =  15.0, fixed, from cluster default depth

 CLUSTER EVENT   7           19670517.0428.50                   GOOD DATA      Depth =   7.0, fixed, from depth phases
 KJN              pP-P     1.00  27.34  344   9.0   1.00  0.00   0.0   0.90   0.90   0.91                       0.0000 0.0053   0.22 ISC          pP          73    0
 UDD              pP-P     1.00  28.86  328   8.9   1.00  0.00   0.0   0.20   0.19   0.20                       0.0000 0.0000   0.00 ISC          pP          79    0

 CLUSTER EVENT   8           19700314.0151.43                   GOOD DATA      Depth =  10.0, fixed, from depth phases
 BUC              pP       1.00  15.16  299  11.1   1.00  0.01   0.0  -2.79  -2.92  -2.98                       0.0000 0.0000   0.00 ISC          sPn         44    0
 BAC              pP       1.00  15.38  307  11.1   1.00  0.02   0.0  -1.22  -1.42  -1.41                       0.0000 0.0000   0.00 ISC          pPn         48    0
 MOX              pP-P     1.00  26.29  308   9.0   1.00  0.00   0.0  -1.17  -1.16  -1.17                       0.0000 0.0000   0.00 ISC          pP         119    0
 KJN              pP-P     1.00  27.50  344   9.0   1.00  0.00   0.0   0.46   0.42   0.45                       0.0000 0.0053  -0.22 ISC          pP         125    0
 OUL              pP-P     1.00  28.74  343   8.9   1.00  0.00   0.0   1.25   1.21   1.24                       0.0000 0.0000   0.00 ISC          pP         136    0
 BAB              pP-P     1.00  39.34  272   8.4   1.00  0.00  -7.1   2.77   2.78   2.77                       0.0000 0.0000   0.00 ISC          pP         181    0
 LAO              pP-P     1.00  91.24  341   4.6   1.00  0.00   3.4  -1.14  -1.05  -1.14                       0.0000 0.0000   0.00 ISC          pP         261    0

 CLUSTER EVENT   9           19740308.0848.16                   GOOD DATA      Depth =  15.0, fixed, from cluster default depth

 CLUSTER EVENT  10           19740312.0653.50                   GOOD DATA      Depth =  15.0, fixed, from cluster default depth
The first lines give information on the statistics of focal depths in the cluster and the current default depth (command depc) that is applied to any event with no other form of constraint. It would be natural to set the cluster default depth close to the median of constrained depths.
In contrast to the ~.dcal_phase_data file, this listing includes any available depth phases, even though they are beyond the hypocentroidal distance limit that is used to select direct arrivals. In some cases the event files list depth phases that for some reason cannot be turned into relative depth phases, like stations BUC and BAC in event 8, so they are listed simply as the depth phase. They won’t contribute to the analysis for focal depth.
The residuals for the relative depth phases seen in this “all available depth-related phases” listing may differ from the ones shown in the earlier “relative depth phase preferred depth” section of this file because the focal depth used in the relocation may not have been the preferred depth shown above. For example the residual for TYK(pP-P) in event 1 listed immediately above is different from the instance listed in the “preferred depth section” because the relocation was run with the depth of this event at 8 km rather than the 5 km preferred depth (but in that case the preferred phase identification would be sP-P). Reference to the “rdpp” plot for this event shows that both depths fit the (limited) data well: