~_rdp Plots
Plots of relative depth phase (i.e., pP-P, sP-P and pwP-P) information for individual events are made by use of the rdpp command. The plots are gathered in a subdirectory of the cluster series directory named ~_rdp and the individual plot files (PDFs) are named ~_rdp_NNN.pdf where “NNN” is the event number.
The content displayed in ~_rdp plots is discussed at length in the section about the ~.depth_phases output file and in the section on depth constraint using teleseismic depth phases. A brief summary is given here.
The construction of the plot has recently been made more flexible in order to accommodate clusters with deeper events. Previously the plot had a maximum depth of 100 km; now it should work for events as deep as 760 km. As a result of the possibility of having to plot much greater focal depths than before, the depth range used in the plot is now based on the uncertainty limits for the estimated focal depth, taken 20 km further on each side. The underlying statistical test to find the best-fitting focal depth is done over the range of current focal depths in the cluster, extended 40 km both shallower and deeper. Here is an example of an event with best-fitting depth at 42 km:
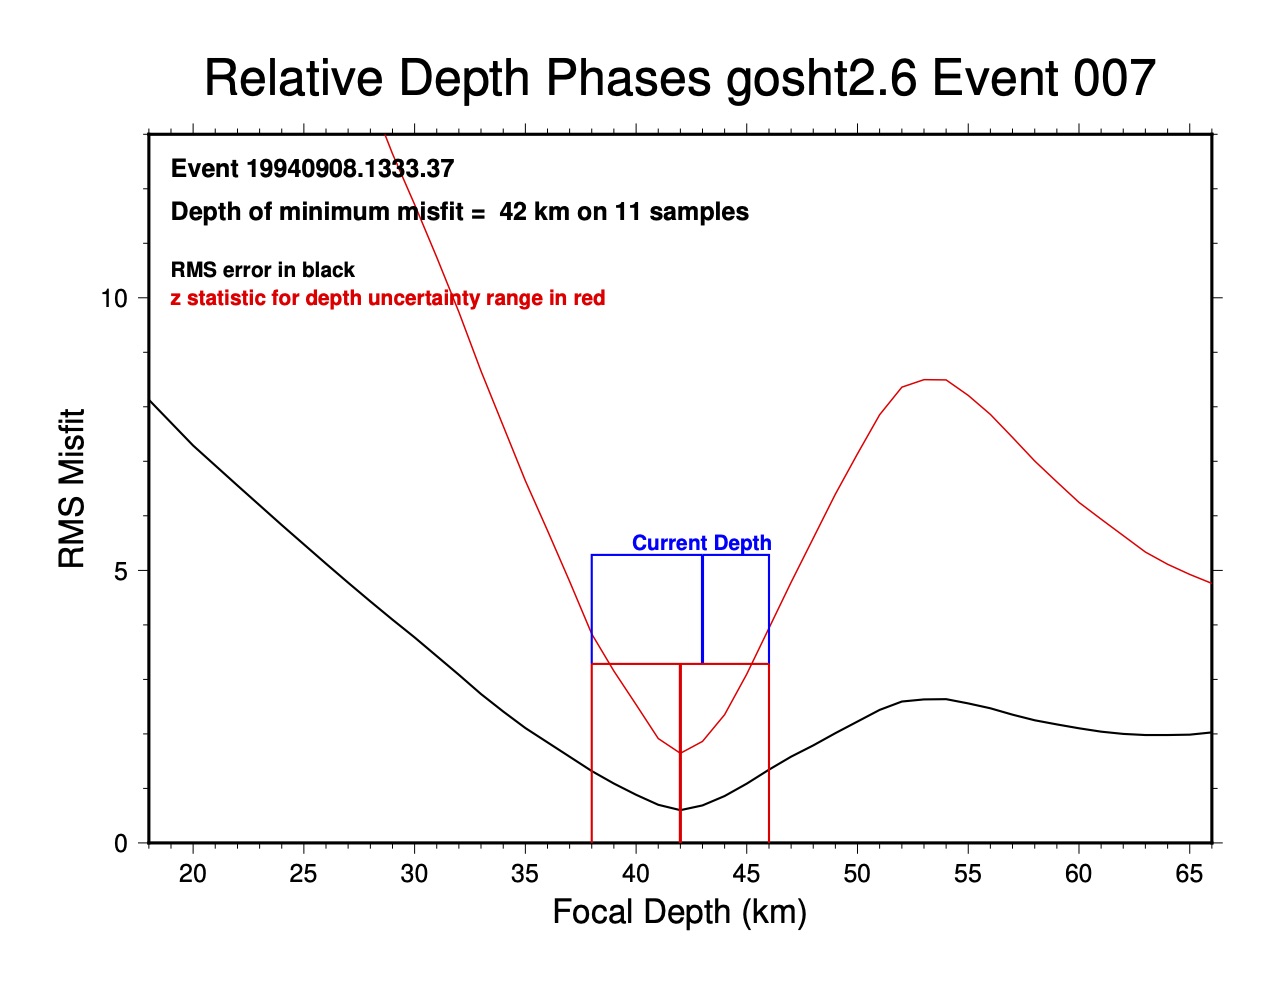
The black curve is the raw RMS error function. The red curve is a statistic (more sensitive than RMS) used to determine the optimal depth and the asymmetric uncertainty range of that depth, described here. The current estimate of depth (in blue) is also shown.