~.ttou Files
~.ttou files are produced by the ttou command, which can be used up to six times in a run of mloc. Each instance of the command specifies a phase for which all corresponding data will be printed to a file named ~_phasename.ttou. These files are carried in a subdirectory of the cluster series directory named ~_tt.
The most common use of this output file is to create a dataset of Lg arrivals that can be quickly analyzed to obtain a model for Lg arrivals (implemented by the lgtt command). Lg travel times can be well-predicted by a model that is linear in epicentral distance with a y-intercept close to zero. The default model in mloc is 31.500 sec/degree with intercept = 0. The format of ~.ttou files is designed for easy import into a data-modelling program, and the Lg travel-time model is estimated by a simple linear least-squares fit. Here is an example, from a cluster near Hutchinson, Kansas (a row of headers has been added for this display):
 No Event name        Depth  MNF Station                 Delta  Az     Obs. TT     Res.  Read Error Flag
  5 20170730.0013.45   5.0    56 TUL3                    2.755 139      86.40     -1.16      0.22
  6 20180301.2026.59   5.0    91 ANMO                    7.464 248     232.87      1.17      1.12
  6 20180301.2026.59   5.0    95 TXAR                    9.859 210     308.62      3.57      0.86
  6 20180301.2026.59   5.0    98 PDAR                   10.001 302     308.60     -0.78      1.14
  6 20180301.2026.59   5.0    99 TKL                    11.649  97     363.34      3.50      0.10   x
  6 20180301.2026.59   5.0   102 ULM                    12.322   6     376.40     -4.03      2.21
  7 20180308.1048.21   5.0   122 TUL3                    2.750 139      85.98     -1.40      0.22
  7 20180308.1048.21   5.0   130 BGNE                    3.393 358     105.74     -1.33      4.00
  7 20180308.1048.21   5.0   146 OGNE                    4.273 315     132.35     -1.66      4.00
  7 20180308.1048.21   5.0   170 ANMO                    7.461 248     232.25      0.64      1.12
  7 20180308.1048.21   5.0   173 TXAR                    9.853 210     308.95      4.10      0.86
  7 20180308.1048.21   5.0   175 PDAR                   10.004 302     308.00     -1.48      1.14
  7 20180308.1048.21   5.0   178 TKL                    11.649  97     359.70     -0.13      0.10
  7 20180308.1048.21   5.0   181 ULM                    12.329   6     373.45     -7.19      2.21
 12 20180414.0246.34   5.0   136 TXAR                    9.860 210     302.15     -2.91      0.86   x
 12 20180414.0246.34   5.0   142 ULM                    12.323   6     380.46     -0.01      2.21
 25 20190816.1259.10   5.0   245 ANMO                    7.449 248     231.58      0.34      1.12
 25 20190816.1259.10   5.0   252 TXAR                    9.838 210     306.46      2.07      0.86
 25 20190816.1259.10   5.0   255 PDAR                   10.005 302     309.95      0.45      1.14
 25 20190816.1259.10   5.0   262 TKL                    11.655  97     360.26      0.25      0.10
 25 20190816.1259.10   5.0   266 ULM                    12.343   6     379.19     -1.88      2.21
 25 20190816.1259.10   5.0   270 ELK                    13.602 287     423.27      3.64      4.00
 36 20190818.0845.29   5.0   237 ANMO                    7.449 248     232.60      1.34      1.12
 36 20190818.0845.29   5.0   240 TXAR                    9.841 210     307.15      2.68      0.86
 36 20190818.0845.29   5.0   243 PDAR                   10.002 302     307.92     -1.48      1.14
 36 20190818.0845.29   5.0   246 TKL                    11.656  97     359.97     -0.09      0.10
 36 20190818.0845.29   5.0   249 ULM                    12.339   6     377.83     -3.13      2.21
 37 20190901.1321.06   4.0    50 ANMO                    7.455 248     231.09     -0.35      1.12
 37 20190901.1321.06   4.0    53 TXAR                    9.846 210     308.68      4.05      0.86
 37 20190901.1321.06   4.0    55 PDAR                   10.005 302     311.50      2.00      1.14
 37 20190901.1321.06   4.0    57 TKL                    11.651  97     359.79     -0.12      0.10
 37 20190901.1321.06   4.0    60 ULM                    12.335   6     377.59     -3.26      2.21
The Lg travel-time model derived from fitting a line to the TT vs. Delta columns is given in subsequent command files as:
lgtt 3.2 30.615 2.5
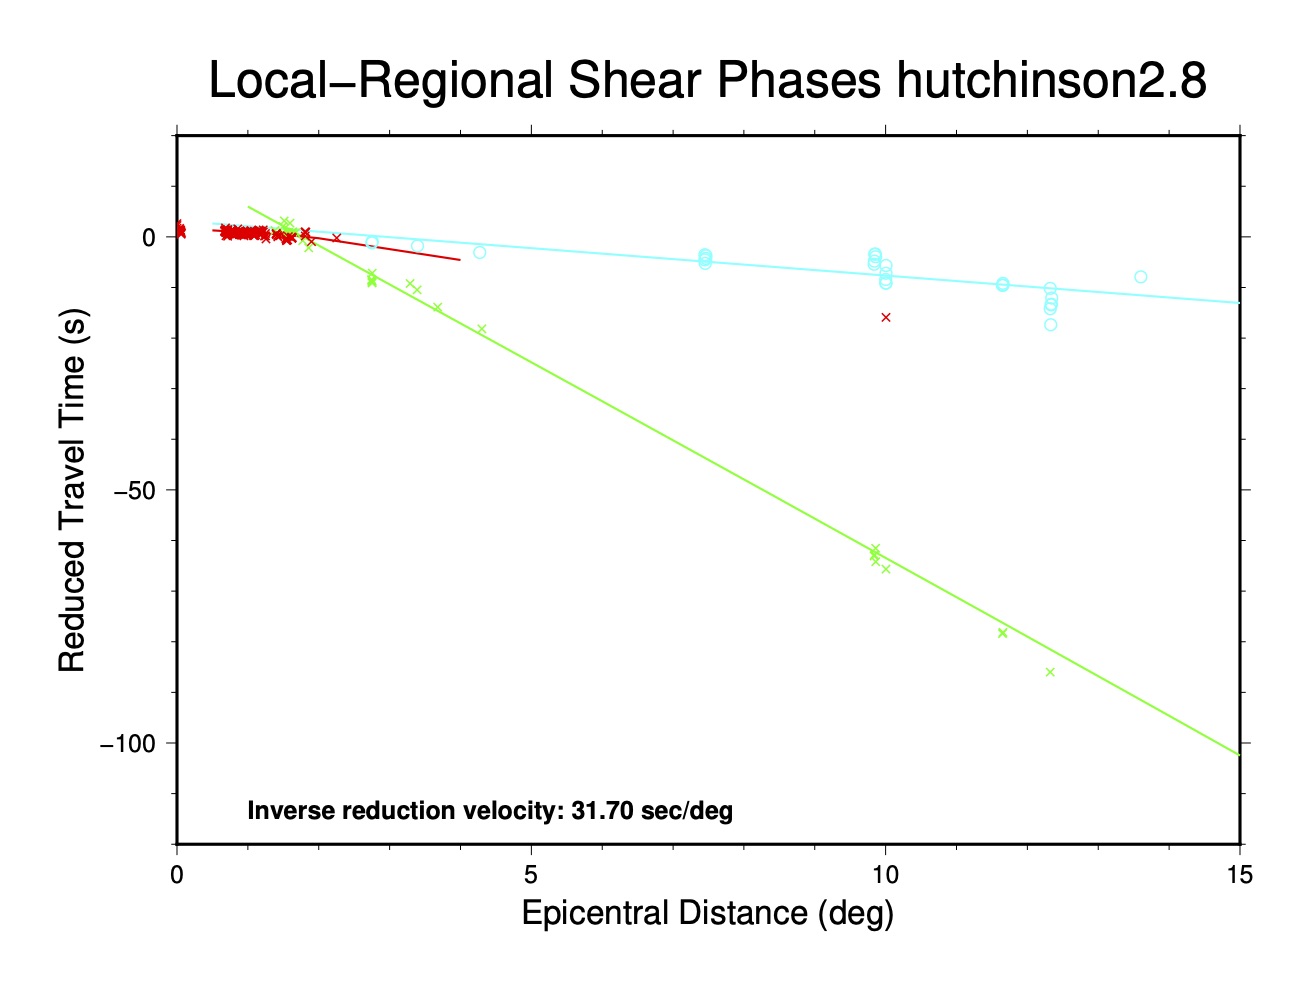
The fit of this model to the Lg data is shown by the turquoise symbols and line in the “Local-Regional Shear Phases” summary plot, one of the summary plots controlled by the pltt command: